
RPA Rubber Process Analyser
Understand your compound before, during and after cure.
Measures viscoelastic properties under variable strain, variable frequency and variable temperature in a sealed, pressurised cavity. One specimen, one loading, gives processability, cure characteristics and final cured properties.
- Oscillation
- 0.05 – 90° of arc
- Temperature
- up to230 °C
Three stages. One loading.
Before cure
Strain and frequency sweeps
Compare incoming polymers, mixed batches and formulation changes. See differences in stiffness, energy loss and flow-related behaviour before the compound enters production.
During cure
Isothermal and non-isothermal testing
Follow scorch, cure development and changes in torque. Study a fixed test temperature or a programmed temperature profile, according to your compound and testing objective.
After cure
Dynamic characterisation
Measure the cured compound's response across selected strain, frequency and temperature conditions. Compare formulations using both cure results and the properties developed after curing.
Control the test. Understand the material.
One loading, a connected test programme
Set strain, frequency and temperature in the test procedure. Link uncured measurements, curing and post-cure characterisation on the same specimen to follow how the compound changes through the programme.
A sealed cavity for controlled deformation
The pressurised cavity confines the specimen at its edge, supporting repeatable measurements at high strain. The Ultimo extends the published strain range to 1256% for investigating behaviour beyond small deformations.
Direct drive with software-set amplitude
Set the oscillation angle in software without changing mechanical spacers. The published strain resolution is 0.0003 arc degree, and an amplitude change does not itself require recalibration.
Straightforward specimen loading
Load the specimen into the cavity and close the dies. Surplus material is expelled as the specimen fills the test space, simplifying preparation between successive tests.
Temperature programmes beyond a fixed setpoint
Both variants include isothermal and non-isothermal cure testing. Programme temperature changes within the instrument's operating range, with maximum heating and cooling rates of 1 °C/s and 0.5 °C/s, respectively.
Strain sweeps for filler-network assessment
Follow the change in storage modulus as strain increases. This Payne-effect response helps compare filler-network behaviour and investigate mixing or dispersion differences between batches of the same formulation.
More information for incoming-polymer QC
Compare the frequency-dependent response of incoming polymers, not only a single viscosity result. Uncured tan δ can reveal differences between materials with similar Mooney viscosity, helping you investigate changes before mixing.
Control at the instrument or across the laboratory
Run tests and review results through the portable console or a server shared by several instruments. The portable console is optional on Primero and standard on Ultimo.
Turn rheology data into better compounding decisions.
How strongly the compound resists deformation
Storage modulus describes the elastic, energy-storing part of the response. In a strain sweep, its change helps you compare the structure of filled compounds. A shift between otherwise comparable batches can prompt a review of mixing, filler incorporation or formulation.
How much energy is lost as the rubber moves
Loss modulus describes the energy-dissipating part of the response. At the same test strain and frequency, a higher G″ means more energy lost per cycle per unit volume. This helps investigate damping and heat-generation tendencies alongside stiffness, rather than judging the compound by stiffness alone.
The balance between elastic recovery and energy loss
Tan δ compares G″ with G′. For two compounds of similar stiffness under the same conditions, the higher value indicates a greater share of energy loss. Compounding teams can use the trend to compare damping, recovery and processing behaviour. Neither the highest nor the lowest value is automatically best for every product.
Resistance to oscillating deformation
Complex viscosity helps compare how a polymer or compound responds across frequencies. It is useful when investigating processing differences between batches. Its value is not automatically interchangeable with a Mooney reading or a steady-flow viscosity measurement.
The elastic and viscous parts of measured torque
S′ is the elastic torque response; S″ is the viscous, energy-dissipating response. They help explain why compounds with similar overall torque may behave differently. The corresponding moduli, G′ and G″, express those responses with the test geometry and strain taken into account.
The development of cure
Scorch and cure-time results help compare how soon a compound begins to cure and how it progresses towards the selected cure level. Read them with the complete curve and test conditions when assessing batch consistency or investigating a formulation change.
A simple example
The same stiffness can hide a different response
Illustrative values, not DAK test data: at the same conditions, two compounds each have G′ = 100 kPa. Compound A has G″ = 20 kPa and tan δ = 0.20; compound B has G″ = 40 kPa and tan δ = 0.40.
What it tells you
Both show the same elastic stiffness at this test point, but B dissipates more energy. That may be useful for damping; it may be undesirable where low energy loss is the goal. The application decides which balance you need.
Compare like with like: compound history, temperature, strain, frequency and cure stage affect the result. Establish a useful target range from known-good material and the requirements of the finished product.
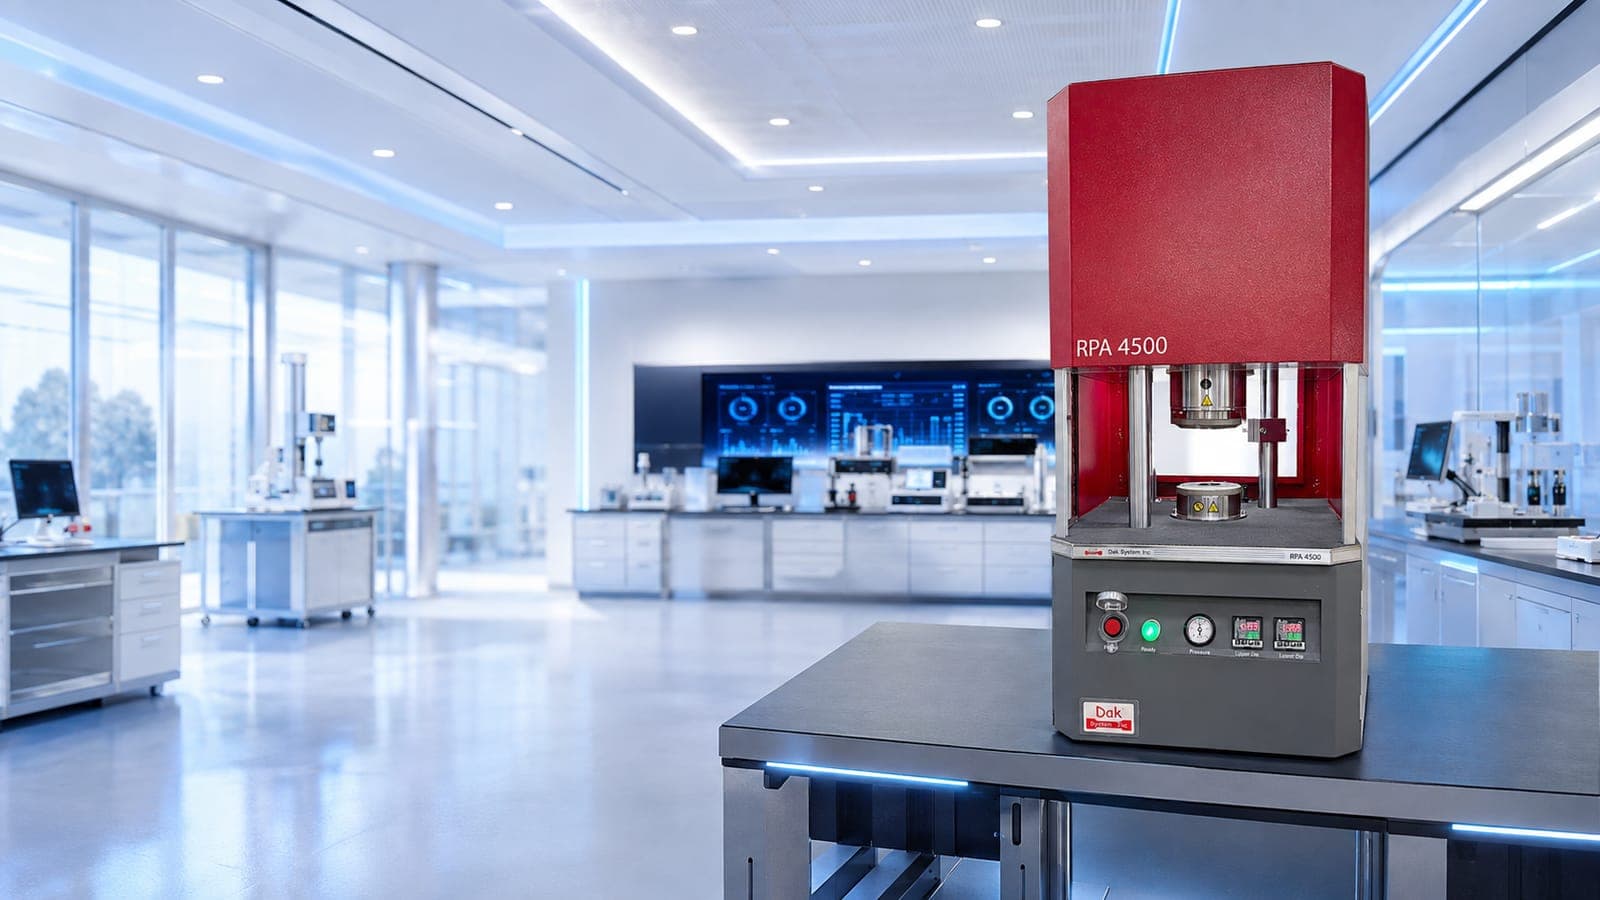
RPA 4500: Primero and Ultimo.
Primero
For a defined processability and cure programme
A strong fit when the required strain, frequency and temperature conditions sit within its published range. Both isothermal and non-isothermal cure are included; add stress relaxation, the advanced wave maker, enhanced cooling or a portable console when your programme needs them.
Ultimo
For a wider characterisation programme
Choose the wider strain and frequency ranges, lower published torque minimum and temperature capability up to 230 °C when those conditions matter to your work. Stress relaxation, the advanced wave maker, enhanced cooling and the portable console are standard.
Compare the key differences
| Parameter | Primero | Ultimo |
|---|---|---|
| Torque range | 0.001 – 20 N·m | 0.0001 – 20 N·m |
| Oscillation angle | ±0.1° – ±10° arc (1.4 – 100% strain), continuously variable | ±0.02° – ±90° arc (0.28 – 1256% strain), continuously variable |
| Oscillation frequency | 0.1 – 10 Hz (6 – 600 cpm) | 0.0016 – 50 Hz (0.1 – 3000 cpm) |
| Temperature range | Room temperature +10 °C to 200 °C | 25 – 230 °C |
| Stress relaxation / advanced wave maker / enhanced cooling / portable console | Optional | Standard |
Complete specifications
Torque & strain
- Torque range, Primero
- 0.001 – 20 N·m
- Torque range, Ultimo
- 0.0001 – 20 N·m
- Torque transducer
- Ultra-high stiffness
- Torque units
- dN·m, lbf·in, kgf·cm or N·m
- Oscillation angle, Primero
- ±0.1° – ±10° arc (1.4 – 100% strain), continuously variable
- Oscillation angle, Ultimo
- ±0.02° – ±90° arc (0.28 – 1256% strain), continuously variable
- Strain resolution
- 0.0003 arc degree
- Additional accuracy torque range
- Optional on the Ultimo
Frequency & drive
- Oscillation frequency, Primero
- 0.1 – 10 Hz (6 – 600 cpm)
- Oscillation frequency, Ultimo
- 0.0016 – 50 Hz (0.1 – 3000 cpm)
- Motor
- Direct drive
- Motor inertia
- Middle inertia (Primero), low inertia (Ultimo)
- Advanced wave maker
- Optional on the Primero, standard on the Ultimo
Temperature
- Temperature range, Primero
- Room temperature +10 °C to 200 °C
- Temperature range, Ultimo
- 25 – 230 °C
- Maximum heating ramp
- 1 °C/s
- Maximum cooling rate
- 0.5 °C/s
- Cooling system
- Built in at room temperature, individual air control for each die
- Enhanced cooling
- Air at 5 – 10 °C — optional on the Primero, standard on the Ultimo
- Temperature units
- °C or °F
Tests, data & reporting
- Test types
- Frequency sweep, strain sweep, temperature sweep, cure, variable temperature analysis, timed
- Stress relaxation
- Optional on the Primero, standard on the Ultimo
- Measured data
- Torque, temperature, frequency, strain
- Cure results
- ML, MH, MH−ML, S″ at ML, tan δ at ML and MH, ts1, ts2, tc10, tc50, tc90, max cure rate, time at max cure rate
- Dynamic results
- G′, G″, G*, S′, S″, S*, tan δ, η′, η″, η*
- Isothermal cure
- Standard on both variants
- Non-isothermal cure
- Standard on both variants
- Reports & export
- Numerous formats
Physical & installation
- Test cavity
- Sealed and pressurised
- Weight
- 180 kg (Primero), 250 kg (Ultimo)
- Dimensions
- 32 × 32 × 43 in (Primero), 32 × 32 × 49 in (Ultimo)
- Air supply
- 80 psi (5.6 kg/cm², 551 kPa) minimum
- Electrical supply
- 220/240 Vac ±10%, 60 ±3 Hz, 20 A three phase, or 440/480 Vac ±10%, 50 ±3 Hz, 10 A three phase
- Portable console
- Optional on the Primero, standard on the Ultimo
Control environment: Windows 11, 64-bit. Explore control and analysis software
Buy the information your laboratory needs.
Start with a production question
Bring a known-good batch and a batch that behaved differently. Agree which difference the RPA needs to investigate before selecting ranges or comparing quotations.
Look for useful, repeatable separation
Run repeated tests on fresh specimens under the same preparation and test conditions. Compare the full curves and the spread of the selected results, not only the best-looking demonstration.
Match the variant to the whole programme
Check the required strain, frequency, torque and temperature together. Include cooling, stress relaxation and console needs in the configuration, so quotations cover the same scope.
Plan the daily laboratory workflow
Review loading, test time, cleaning, calibration, result interpretation, reports and operator training. Agree the installation requirements and ongoing support as part of the purchase.
Start with the question you need to answer.
| Your question | An RPA programme to discuss | What the results help you do |
|---|---|---|
| An incoming polymer behaves differently in mixing | Frequency sweep on uncured material | Compare η*, G′, G″ and tan δ against a known-good lot; investigate the change before altering the production recipe. |
| Mixed batches differ despite the same formulation | Strain sweep at controlled temperature and frequency | Compare the G′ curve and Payne-effect response; investigate filler-network and mixing consistency. |
| Extrusion behaviour or surface finish has changed | Frequency and strain sweeps, considered with cure data | Investigate elastic and loss responses that a routine cure test alone may not explain; correlate findings with the line conditions. |
| A formulation change affects processing and cure | An uncured programme followed by a cure test | Assess the processing-related response and cure development together, rather than optimising one result in isolation. |
| Cured compounds feel similar but perform differently | Post-cure sweeps within the selected variant's range | Compare stiffness and energy-loss behaviour at relevant conditions; use finished-product testing to establish the acceptance relationship. |
| Stress recovery is important to the application | Stress-relaxation programme | Study how stress decays after an imposed deformation. This option is available on Primero and standard on Ultimo. |
Why one number is not always enough.
Similar Mooney values, different uncured behaviour
DAK's published application example compares two SBR 1006 materials with similar Mooney values but different uncured tan δ responses. A frequency sweep adds a second view of the material when one incoming-inspection number does not explain its behaviour.
A stronger distinction under a temperature programme
A published DAK example reports 1.5 times the scorch sensitivity for a non-isothermal comparison. It examines two lots of one compound, with five repeat tests per lot. The result illustrates how the test programme can improve discrimination for a particular compound.
Relating RPA results to an established QC measure
A separate published comparison across 23 SBR materials reports R = 0.95 between Mooney viscosity and an RPA measurement. This shows the value of a material-specific relationship; it does not turn every RPA result into a substitute Mooney value.
RPA or MDR: choose the depth of information your work needs
RPA for compound characterisation
Choose the RPA when you need to vary strain, frequency and temperature to investigate processability, filler-network behaviour or dynamic properties before and after cure. It combines those investigations with cure testing in a programmable instrument.
MDR for focused cure-control work
Choose the MDR Elite-6300 where the main job is repeatable routine cure testing. DAK's MDR also provides elastic and viscous torque and tan δ; these outputs alone are not the reason to choose an RPA. The distinction is the wider variable-condition characterisation programme.
Connect your test programme with the relevant method.
Uncured rubber rheology
Connect incoming-polymer and uncured-compound questions with a rotorless shear rheometer programme.
Explore ASTM D6204Cure characterisation
Explore rotorless cure testing and the preparation, settings and results involved.
Explore ASTM D5289Cure and after-cure properties
Connect curing with dynamic measurements of the cured compound at selected lower test temperatures.
Explore ASTM D6601Rubber compounds, tyres, seals and hoses
Connect compound characterisation with the wider mechanical-testing requirements of your products.
Explore rubber testingDAK systems in customer applications
See how DAK testing systems support compound studies and the evaluation of tyre-related components.
See DAK systems in tyre-industry testingPractical answers about RPA testing.
What is a Rubber Process Analyser used for?
A Rubber Process Analyser, also written Rubber Process Analyzer, measures how rubber responds to controlled deformation. It helps laboratories investigate raw polymers, uncured compounds, cure development and cured dynamic properties. The DAK RPA 4500 varies strain, frequency and temperature in a sealed, pressurised cavity.
What does a strain sweep tell a rubber compounder?
A strain sweep changes the size of the deformation while the other selected conditions are held constant. It shows whether the compound responds similarly to small and large movements. In filled rubber, the change in G′ helps assess the Payne effect and compare filler-network behaviour between controlled batches.
Does the Payne effect give a filler-dispersion percentage?
Not by itself. A strain sweep gives a numerical change in response, often assessed through the drop in G′ between agreed strain levels. Filler loading, filler type, polymer, mixing history and test conditions can all influence it. Compare the same formulation under the same programme, and relate the result to an established dispersion assessment where that is your objective.
Why use a frequency sweep instead of one test frequency?
It shows how the response changes when the deformation becomes slower or faster. Two materials can appear similar at one test point but separate elsewhere in the sweep. Comparing viscosity-related response, stiffness and tan δ can help investigate incoming-material or processing differences that one number misses.
Can an RPA replace a Mooney viscometer?
It can add information that a single Mooney result does not provide, but the measurements are not automatically interchangeable. Where a customer specification requires a Mooney result, continue to use the required method. A correlation developed for a defined material family can support your QC work without becoming a universal conversion.
Is a high or low tan δ better?
It depends on the job. A higher tan δ means more loss relative to elastic response at the stated conditions, which can be useful for damping. Lower loss may be desirable where energy efficiency or elastic recovery matters. Use G′ and G″ as well as the ratio, and establish the target using a suitable reference compound and product-performance results. Tan δ is not universally restricted to 0–1.
Does a higher G″ mean the compound will run hotter?
At equal strain and frequency, a higher G″ means greater energy dissipation in the oscillatory test. That makes it useful when investigating heat-generation tendencies. Actual processing or service temperature also depends on geometry, deformation, cooling and operating conditions, so use the RPA trend alongside the real application rather than treating it as a temperature prediction.
How should I choose between Primero and Ultimo?
Start with the conditions and options your programme requires. Primero covers a defined processability and cure programme within its listed ranges. Ultimo extends strain, frequency, low-torque and temperature capability, and includes several options as standard. Compare the complete specifications and your intended tests, not just the largest number in a brochure.
Can the RPA test before, during and after cure on one specimen?
Yes. The RPA 4500 can link those stages in one loading. The programme sets the sequence, temperature, strain and frequency. Earlier deformations and thermal history affect the specimen, so keep the same sequence when comparing batches or formulations.
What should I include in an RPA quotation enquiry?
Share the polymer or compound family, the problem you want to investigate, required methods, expected test conditions, sample volume or daily workload, and installation country. Mention cooling, stress-relaxation, console and reporting needs. DAK Engineering can then help define the variant and complete configuration.
Build the RPA programme around your compound
Tell us what you test, what changes you need to detect and where the instrument will be installed. DAK Engineering can help you choose Primero or Ultimo and the test options that support your laboratory's work.
For customers in India and overseas, DAK supports demonstrations, installation planning, operator training and technical assistance. See our Support page for the international-buyer information.
Useful details to share
- Polymer or compound family
- Production or research question
- Required methods and test conditions
- Daily workload and reporting needs
- Required options
- Installation country