Standard Test Method for Compressive Properties of Rigid Cellular Plastics
Written and technically reviewed by Dak System Inc. engineering·Last reviewed
ASTM D1621 measures the compressive properties of rigid cellular plastics — insulation boards, structural foams and foam cores. A prism is compressed between parallel platens at a rate of about 10 % of its height per minute. Where the specimen yields, compressive strength is the stress at yield; where it does not, the reported figure is the stress at 10 % deformation.
A prism of rigid cellular plastic, at least 25.8 cm² in section and between 25.4 and 50.8 mm high, is stood between two parallel compression platens with the upper one free to self-align. The platens close at a rate that deforms the specimen at about 10 % of its original height per minute — 2.5 mm/min for a 25.4 mm specimen. Force is recorded against platen separation. The test continues past yield where the material yields, or to 10 % deformation where it does not. The direction in which the specimen is loaded relative to the foam's rise direction is recorded, because it changes the answer substantially.
What it measures, and why it matters
The method reports compressive strength at yield, or stress at 10 % deformation where there is no yield, and compressive modulus where required. These figures govern every application in which a rigid foam carries load rather than merely occupying space: insulation under screeds and in flat roofs, cold-store flooring, foam cores in sandwich panels, and packaging designed to protect by crushing in a controlled way. In a sandwich panel the core's through-thickness compressive strength is what resists local loads and fastener crushing, and it is often the property that limits the panel rather than the facings. Compressive strength also tracks density and cell quality closely, which makes it a sensitive production control.
Specimen
Rigid foam is usually anisotropic — it is stronger along the direction the cells grew — so the orientation of the specimen is part of the result rather than a detail of preparation.
Minimum area
25.8 cm² (4 in.²)Enough cells across the section for the specimen to behave as a material rather than as a handful of cells.
Height
25.4 mm to 50.8 mmShort enough that the prism crushes rather than buckling.
Faces
Flat and parallelA self-aligning platen forgives a little; it cannot forgive a wedge.
Orientation
Recorded, and consistent within a setRise direction and the transverse directions give different strengths in most rigid foams — often by a factor of two or more.
Skin
Removed unless the specification says otherwise
Cut with a fine-tooth blade or hot wire
Not sawn roughlyDakA ragged face makes contact progressively and puts a toe on the curve exactly where the modulus would be read.
A result quoted without the loading direction is close to meaningless for a rigid foam. Rise-direction and transverse strengths differ enough that they are effectively different materials.
Test speed
Strain rate
About 10 % of original height per minuteExpressed as a rate rather than a fixed speed, so a 25.4 mm specimen runs at 2.5 mm/min and a 50.8 mm one at about 5 mm/min.
End of test
At yield, or at 10 % deformationMany rigid foams show a clear yield followed by a plateau of cell collapse; brittle grades may not.
Report which applied
AlwaysDakA strength at yield and a stress at 10 % deformation are different quantities. Only one of them exists for a given specimen.
Calculations
Compressive stressσ
σ = F / A₀
F
force, N
A₀
original cross-sectional area, mm²
Compressive deformationε
ε = Δh / h₀ × 100
Δh
reduction in height, mm
h₀
original height, mm
Compressive modulusE
E = Δσ / Δε over the initial straight portion
Only meaningful once any toe from imperfect seating has been corrected out. On a foam with rough-cut faces the uncorrected slope can be badly low.
How the test runs
01Cut prisms of at least 25.8 cm² area and 25.4 to 50.8 mm height, noting the rise direction.
02Remove skin unless the specification requires it to stay.
03Measure the section and height of each specimen.
04Condition in the standard laboratory atmosphere.
05Check the platens are parallel and that the upper one is free to self-align.
06Stand the specimen centrally and close to light contact.
07Zero force and displacement at contact, not at a gap.
08Compress at about 10 % of the specimen height per minute.
09Continue past yield, or to 10 % deformation where no yield appears.
10Correct any toe before taking a modulus slope.
11Report the loading direction with every value.
The fixture this method needs
5 to 400 kNTJ-125
Direct Compression Fixture
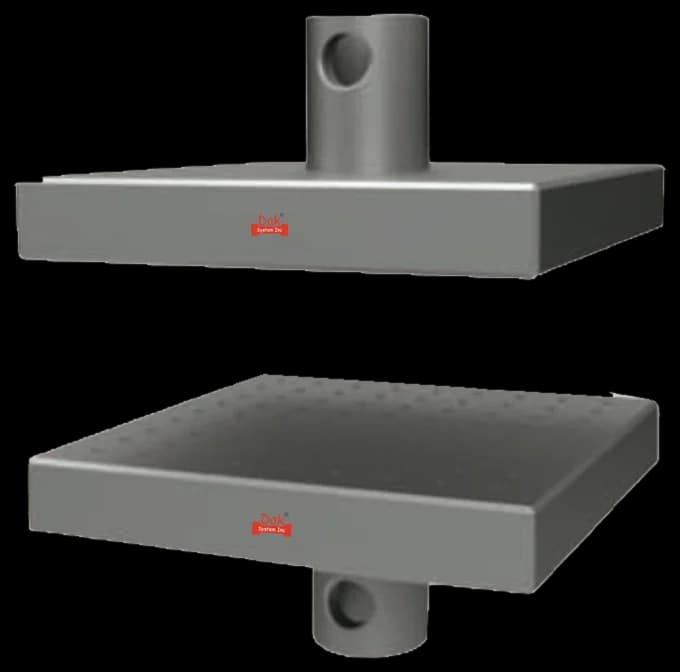
Direct compression platens with a self-aligning upper face. Self-alignment matters more here than on rigid plastics — a cut foam face is rarely perfectly parallel, and a fixed platen would load one edge first.
Compressive strength at yield, or stress at 10 % deformation, stated as which
Compressive modulus where determined, with the toe correction described
Number of specimens, mean and standard deviation
What the machine must be capable of
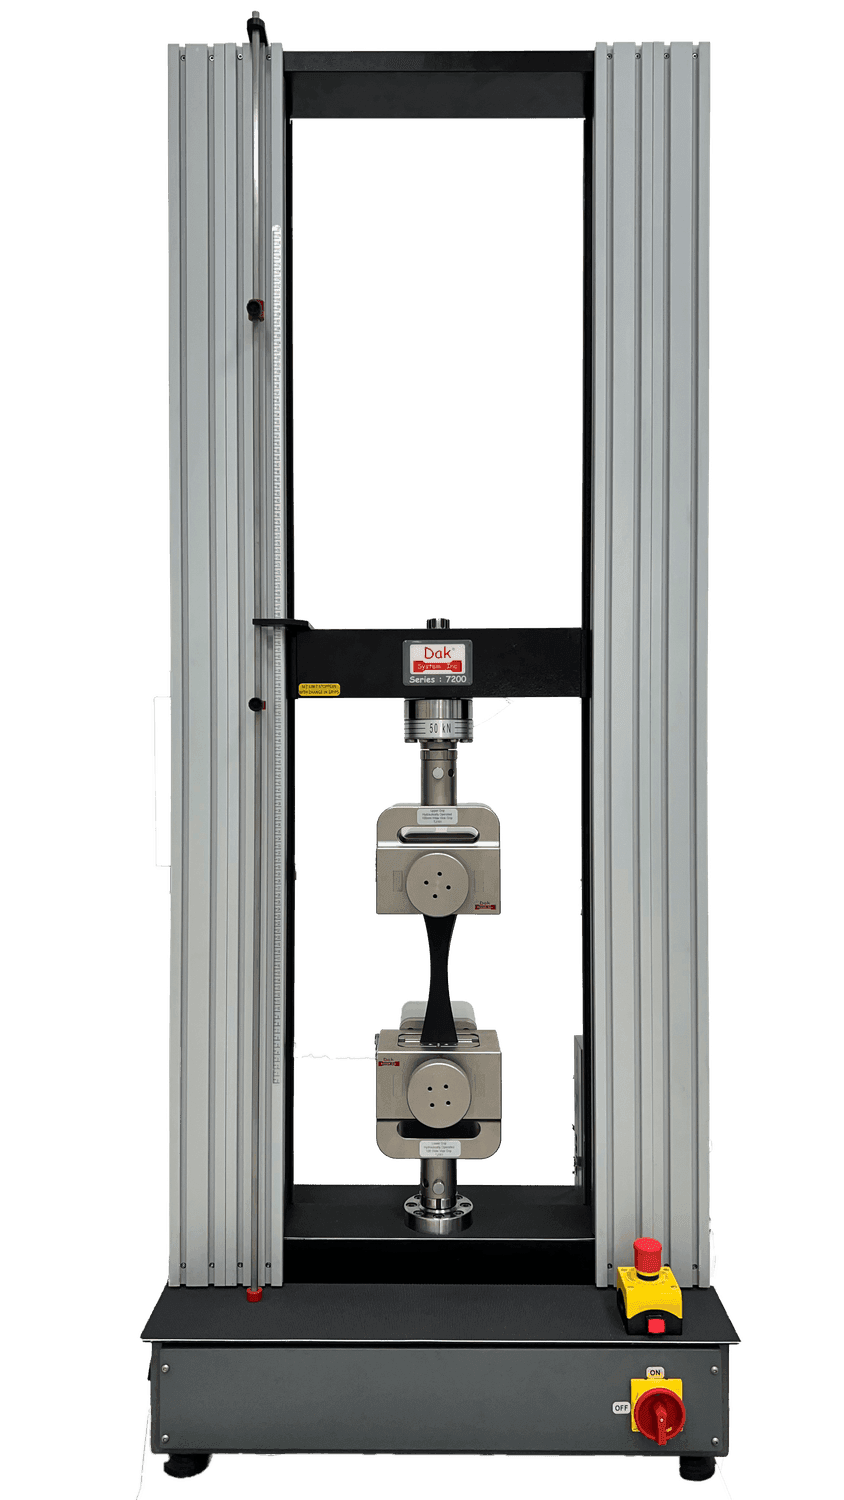
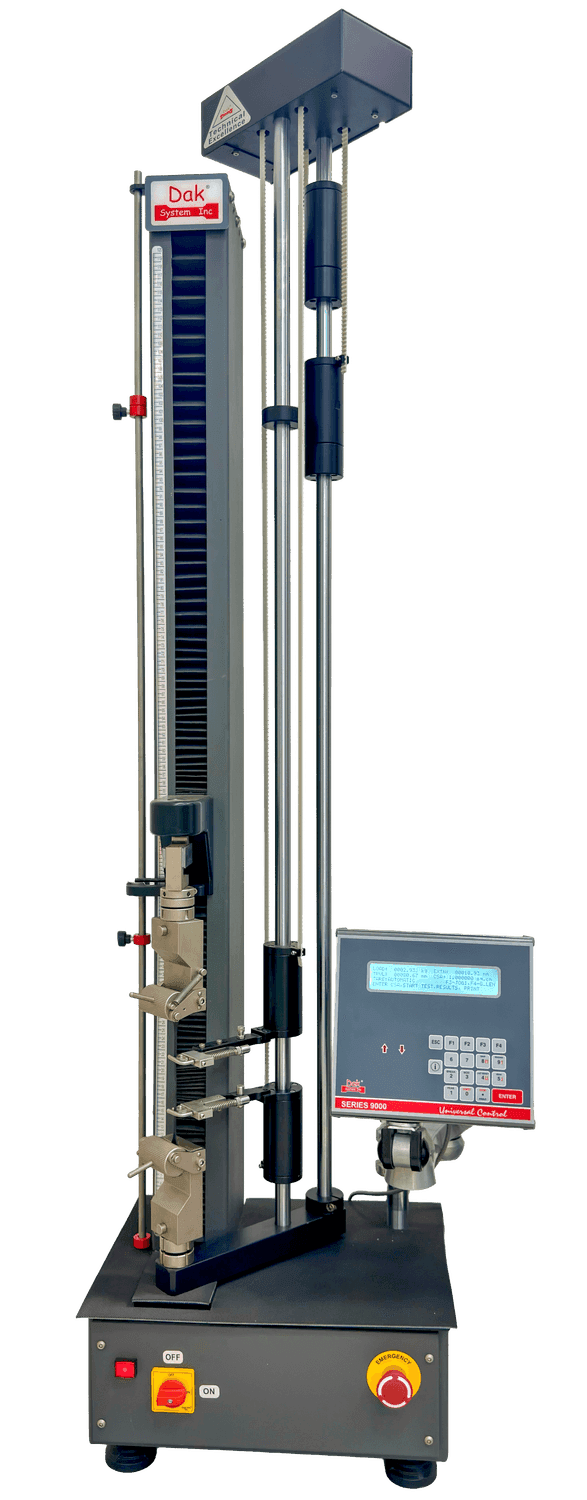
A frame with force measurement to ASTM E4 across a range that may run from a few hundred newtons for lightweight insulation to tens of kilonewtons for dense structural foam, and a crosshead that holds a slow rate accurately — 2.5 mm/min for the standard specimen. Platens must be parallel, larger than the specimen, and the upper one free to self-align, which matters more here than for rigid plastics because a cut foam face is rarely perfectly parallel. Deformation is taken from platen separation, so the contact datum must be set under light load rather than from a gap, and frame compliance is part of the measured travel on stiffer grades.
What goes wrong in practice
The most damaging error is omitting the loading direction, because rise-direction and transverse strengths can differ by a factor of two and a mixed data set then looks like an unstable process. The second is confusing the two possible outputs — a strength at yield and a stress at 10 % deformation are different quantities, and only one exists for any given specimen. The third is a toe on the curve from roughly cut faces, which depresses modulus and shifts the deformation axis; a fine-tooth blade or hot wire and a self-aligning platen remove most of it. Leaving the skin on inflates strength substantially, and running all specimen heights at one crosshead speed strains them at different rates.
ASTM D1621 or ISO 844
ASTM D1621
ISO 844
Specimen
Minimum 25.8 cm² area, 25.4–50.8 mm high
Commonly a 50 mm cube or comparable prism
Rate
About 10 % of height per minute
Rate set to give a comparable relative deformation
Where no yield occurs
Stress at 10 % deformation
Stress at 10 % relative deformation
Anisotropy
Direction recorded
Direction recorded
The two methods agree in intent and usually in result, but the specimen geometries are not identical and rigid foams are geometry-sensitive. Where a specification names one, run that one.
Questions we are asked about this test
What is ASTM D1621?+
It is the ASTM test method for the compressive properties of rigid cellular plastics — insulation boards, structural foams and foam cores. A prism is compressed between parallel platens at about 10 % of its height per minute, and the method reports compressive strength at yield where the specimen yields, or the stress at 10 % deformation where it does not.
Why is the speed given as a strain rate rather than a fixed mm/min?+
So that specimens of different heights are deformed at the same relative rate. Rigid foams are rate-sensitive, and a 25.4 mm specimen and a 50.8 mm one run at the same crosshead speed would be strained at quite different rates and give different strengths. Ten per cent of the original height per minute works out at 2.5 mm/min for the shorter specimen and about 5 mm/min for the taller.
Does loading direction matter?+
More than almost anything else in the test. Most rigid foams are anisotropic because the cells elongate along the rise direction as the foam expands, and the compressive strength along the rise can be double the transverse value or more. A result quoted without the direction is close to meaningless, and comparing a rise-direction figure with a transverse one looks like a material difference when it is a geometry difference.
What if my specimen never yields?+
Then there is no compressive strength to report and the method says so explicitly: report the stress at 10 % deformation instead, identified as such. Some rigid foams crush progressively with no clear yield point. The two quantities are not interchangeable, and mixing them within a data set produces scatter that has no material cause.
Why is my modulus low?+
Almost always a toe on the curve from imperfectly cut faces. Foam is cut rather than machined, and a ragged or non-parallel face makes contact progressively rather than all at once, so the early part of the curve is soft. That softness is included in the slope unless it is corrected out. A fine-tooth blade or hot-wire cut and a self-aligning platen remove most of it.
Should the skin be removed?+
Yes, unless the specification requires otherwise. The skin on a moulded or lamination-faced board is much denser than the core and can carry a large share of the load at a thickness of a millimetre or two, which makes the specimen look far stronger than the foam is. Where the board is used with its facings, that is a different test on a different article.
What is this test actually used for?+
Chiefly for insulation boards that carry load — under screeds, in flat roofs, in cold-store floors — and for foam cores in sandwich panels, where the core must resist the through-thickness compression that local loads and fastenings apply. It is also the routine production control for rigid foam density and cell quality, since compressive strength tracks both closely.
This page describes the method as practised. The governing text is the current edition from the issuing body. Tell us what you are testing and we will answer with the machine, the fixture and a quotation.